9 Important Sales Pipeline Metrics to Track in 2026


A well-managed pipeline gives you that kind of visibility by showing you exactly what your team is juggling each day, helping you forecast with more confidence and make decisions that feel thoughtful rather than rushed. Buyers move fast and often compare several solutions at once, so leaning on instinct alone can leave you guessing at the wrong time.
Having the right metrics in front of you gives you a clearer sense of what is working, what needs attention, and what deserves a closer look before it becomes a real issue.

When you track the right numbers consistently, everyday activity starts to form a story you can actually use. Instead of wondering why a deal suddenly stalls or why your forecasted sales feel slightly off, you begin to recognize patterns before they grow into bigger issues. The teams performing well tend to combine solid measurement with practical, real-world adjustments, using data as a guide rather than something heavy or complicated. That is the goal of this guide. These nine metrics are broken down in a way that feels easy to follow, with context, examples, and clear takeaways that help you apply what matters to your own process without feeling overwhelmed.
In this guide, you will learn:
- Why each pipeline metric matters
- How to interpret strong vs. weak performance
- Practical steps for improving each metric
- How to connect metrics to real buying behavior
What Sales Pipeline Metrics Show
When you peel back the layers of your sales pipeline, these metrics give you a real picture of what is happening day to day. They show whether you have enough opportunities coming in, whether those opportunities are advancing, and whether your team is converting interest into meaningful progress. Instead of guessing where deals slow down or why forecasts are off, these numbers make the patterns easier to see.
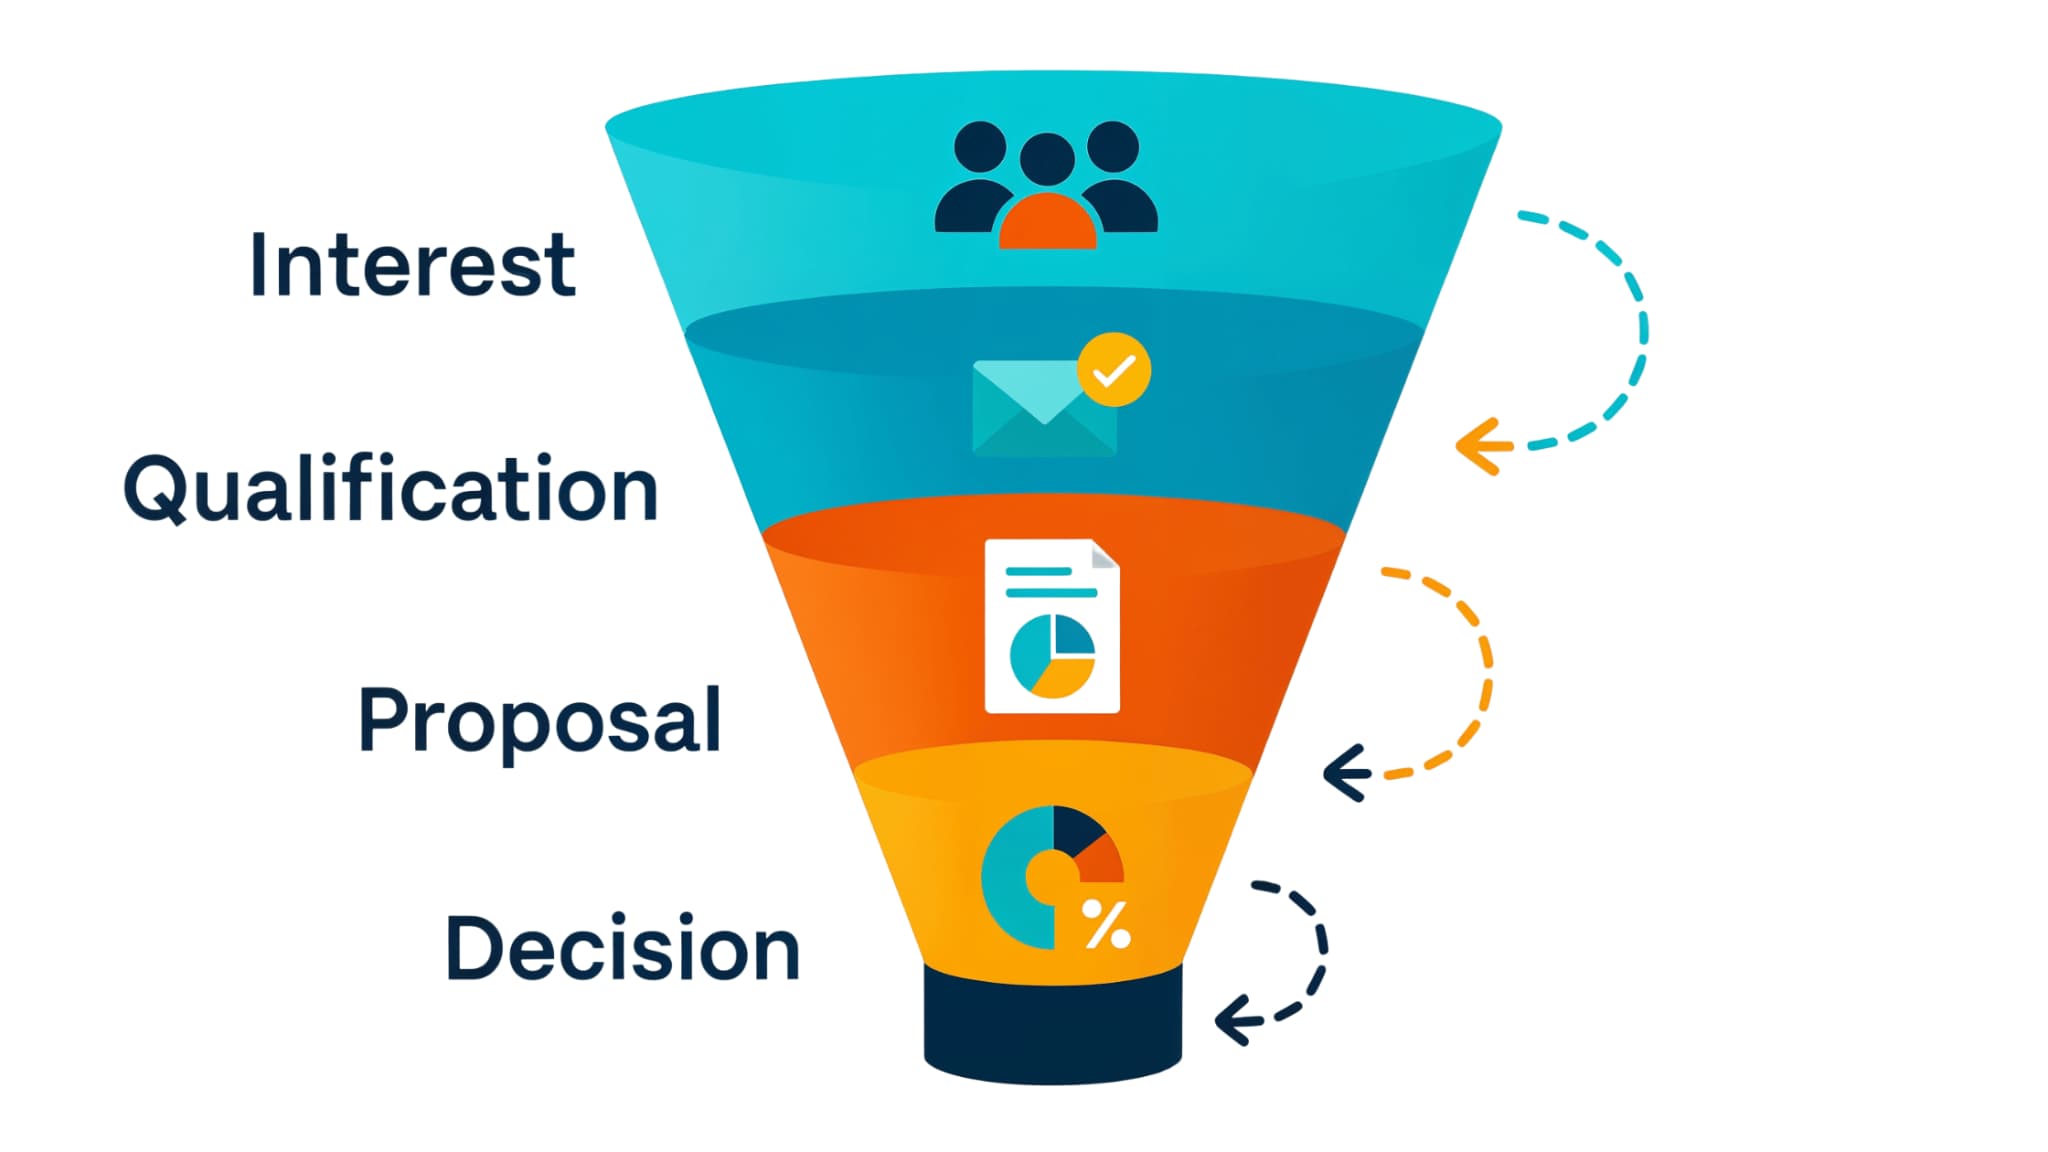
Most pipelines follow familiar stages: from early interest through qualification, evaluation, proposal, and finally to a decision. Metrics help you understand how prospects move through each step so you can spot the moments where buyers hesitate or lose momentum. When you review this consistently, decision-making becomes less about intuition and more about noticing what the data has been trying to tell you.
Pipeline metrics help teams:
- Feel more confident in your sales forecasts by basing them on what is actually happening in the pipeline, not guesswork.
- Spot deal slowdowns earlier, before they lead to an underperforming month or quarter.
- Get a clearer sense of whether your messaging is resonating with buyers.
- See which campaigns or channels are generating the most qualified leads that convert into paid customers.
A measurement framework like this also encourages stronger, more practical discussions among your team. When everyone uses the same reports, it becomes much easier to diagnose issues, align on next steps, and maintain momentum across the entire pipeline.
1. Number of Sales Opportunities
A steady stream of opportunities is what keeps your pipeline alive, and you can usually feel it when that flow starts to shift. A strong pipeline often shows a mix of fresh leads, active conversations, and late-stage deals that feel close to the finish line. When the volume is healthy and the distribution makes sense, your team has enough room to prioritize without feeling stretched thin.
To get a real sense of how this metric is performing, it helps to look at it from a few angles.
What strong performance looks like:
- Consistent creation of new opportunities each week or month
- A natural spread across early, middle, and late stages
- Opportunities that genuinely fit your ideal customer profile
Things tend to get tricky when the opportunity count dips, and it rarely happens overnight. You might see fewer qualified leads than usual, or notice early opportunities that look promising at first but then stall. In fact, small shifts like these are usually tied to the marketing channel from which those leads are coming, especially when certain sources fluctuate in quality or fit over time.
You’ve likely experienced this in your own reviews. One week, the pipeline looks full and reassuring, then a few days later, you notice most of those leads are still untouched or sitting in early stages. That kind of surface-level momentum can be misleading, especially when campaigns attract people who were never a strong fit to begin with.
Based on patterns across many teams, the most helpful way to read this metric is to look at volume and movement together. If early-stage opportunities are rising but fewer deals progress, your qualification or lead follow-up automation may need another look.
A few simple weekly questions can make these patterns easier to spot:
- Which channels consistently bring in higher fit opportunities?
- Are early-stage leads actually moving forward, or just sitting with no next step?
- Did opportunity volume spike or drop because of seasonal shifts or campaign timing?
These quick check-ins help you catch small issues before they become bigger problems, giving your team a steadier, more realistic view of how the pipeline is trending.

2. Lead Response Time
Building on the importance of opportunity volume, the next step is understanding how quickly your team engages the leads you already have.
If delayed follow-ups are common, explore how sales and marketing automation can help streamline outreach.
Lead response time measures how quickly your team engages new prospects. Research from the Harvard Business Review found that companies that responded within an hour were nearly seven times more likely to qualify leads than those who waited longer.
Why response time matters:
- Buyers often evaluate multiple providers at once
- Fast replies create trust and set a strong first impression
- Delayed responses lead to disengagement or lost opportunities
Common causes of slow response times:
- Leads are routed to the wrong team members
- Manual follow-up tasks with no automation support
- High volume surges without sufficient oversight
Here’s where teams can make quick progress with response time. Setting clear ownership for new inquiries keeps leads from getting lost in the handoff, and according to patterns we see across many sales teams, even small tweaks here prevent a surprising amount of delay. Automated lead assignment and follow-up ensure all leads are routed to the right team member and are automatically contacted within the first few minutes.
When teams measure this consistently, response time is one of the easiest metrics to improve, since the fixes are practical and repeatable. In fact, a few small adjustments in workflow or automation can dramatically increase the number of leads who stay engaged long enough to qualify. That’s why improving response time often creates an immediate lift in overall qualification rates.
3. Email Engagement Rate
After response time, the next thing to pay attention to is how people actually respond once you reach out. This is where email engagement becomes especially telling because it gives you a real-world look at what is catching someone’s eye and what isn’t.
Email engagement shows how your messages resonate with prospects, how much interest they spark, and whether they motivate someone to take a small next step. When open rates rise, it usually means your subject lines feel relevant or personal enough to stand out in a busy inbox. Click-through rates help you see whether the message itself felt useful or interesting. Reply rates or meeting booked rates are often the strongest signal, because this is usually a clear indication that the lead is interested and is progressing forward in the pipeline.
Key components of email engagement:
- Open rate, which shows whether your subject lines feel worth opening
- Click-through rate, which reflects whether the content offered real value
- Reply rate, which gives you a clearer look at intent
These patterns matter because they offer a window into buyers' mental state during their evaluation. A sudden drop in engagement often shows up when messaging feels too generic or when timing falls out of sync with what buyers need. In fact, research from Gartner B2B Buying Behavior Insights suggests that buyers increasingly expect communication tailored to the problem they are trying to solve, rather than their industry or role. When engagement goes quiet, it is usually a sign that prospects are not getting the kind of guidance or reassurance they need to move forward.
Why engagement trends matter:
- High engagement typically points to real buying interest
- Lower engagement often suggests a mismatch between the message and the need
- Engagement patterns help you prioritize who to follow up with
A practical way to use this metric is to examine engagement at each stage of your pipeline. Early on, buyers tend to respond to simple explanations or helpful resources, but as they get closer to a decision, they usually expect more specifics or comparisons. If engagement consistently drops at the same stage, it often means you are missing the kind of content or context that helps them take the next step with confidence.
Ways to strengthen email engagement:
- Personalize messages based on stage, behavior, or industry
- Keep emails short, relevant, and focused on one next step
- Test variations in tone, timing, or structure to see what resonates
Automation can also help you respond more quickly and naturally. Setting behavior-based triggers in your sequences, like sending a follow-up after someone clicks or pausing outreach when they go quiet, keeps your communication aligned with buyer behavior.
Email engagement becomes one of the earliest indicators of buyer hesitation, often long before a deal slows down in your pipeline. When you look at these signals with curiosity rather than pressure, they make it easier to refine your messaging, improve your timing, and support buyers in a way that feels human and genuinely helpful.

4. MQL to SQL Conversion Rate
Once engagement is established, the next challenge is determining how many of those leads actually progress into meaningful sales conversations.
This metric shows how effectively marketing and sales work together to identify qualified leads. A strong conversion rate means marketing attracts the right audiences and sales receives leads that match the agreed-upon criteria.
Indicators of strong alignment:
- Clear definitions for what qualifies a lead
- Regular collaboration between marketing and sales
- Predictable, steady conversions from MQL to SQL
Signs that conversion rates need attention:
- Large gaps between MQLs created and SQLs accepted
- Frequent disagreements about lead quality
- Sales teams filtering out high volumes of prospects
When teams want to improve this metric, it helps to revisit how they define a qualified lead and make sure everyone uses the same criteria. According to Pulse data, most alignment issues stem from specific marketing channels that send lower-quality leads, making it even more important for both teams to stay aligned on what a strong lead truly looks like. It also helps to check how different lead sources perform over time, because you often discover that one channel quietly produces the strongest fit while another creates extra work without much payoff.
When alignment is strong, leads will move through your pipeline faster.
5. Number of Touchpoints per Deal
As leads move deeper into evaluation, it helps to understand how much interaction buyers typically need before making a decision.
Touchpoints include emails, calls, demos, meetings, and social interactions. Tracking this metric helps teams understand the effort required to move prospects forward.
This metric gives you a sense of how much engagement your audience actually needs, which becomes clear when you compare deals that move easily with those that lag. It also shows whether your messaging is aligning with your leads at each stage of the pipeline, because when prospects hesitate or stop responding, the issue is usually less about interest and more about timing. You need to adjust your personal check-ins, automations, and nurture sequences accordingly.
And when you look closely at how your top performers follow up, you start to see rhythms and habits that make their outreach feel natural instead of forced, revealing patterns you can use to guide the rest of the team.
Examples of patterns teams may notice:
- High-performing reps often use fewer, more targeted touchpoints
- Complex deals require more touchpoints due to stakeholder involvement
When you get to this stage of reviewing touchpoints, it helps to look at them as you would a conversation, noticing what actually moved things forward and what didn’t. In fact, teams often find that winning deals share common touchpoint patterns, while losing deals often reveal gaps or unnecessary steps. You might compare how often certain buyer segments need additional context or reassurance, then use that insight to refine your sequences so they feel more natural and helpful instead of formulaic. The goal isn’t to cut or inflate touchpoints, but rather it’s to make sure each interaction feels like progress, not noise, for the person on the other side.
6. Cost Per Acquisition (CPA)
As you refine the effort behind each touchpoint, it becomes easier to see how those actions contribute to the overall cost of acquiring a new customer.
Cost per acquisition represents the total investment required to acquire a new customer. Sustainable acquisition strategies ensure that costs do not exceed the revenue generated by customers.
When you break down CPA, you’re really looking at the total effort it takes to win a customer, not just the money spent on ads. According to Pulse data, marketing campaigns often get the most attention because they’re visible and easy to quantify, but the real story usually includes the hands-on work your sales team puts in and the systems running in the background to support them. In practice, this means everything from the dollars you spend on campaigns, to the hours reps invest in nurturing prospects, to the technology and operational costs that quietly support each step of the journey.
Warning signs that CPA needs review:
- Costs rising faster than the average deal value
- High dependence on expensive channels
- Manual processes increase labor intensity
Instead of viewing CPA as a set of isolated tactics, think of it as tuning the front end of your entire revenue process. When you tighten your targeting, you naturally attract people who are already a better fit, which means your team spends less time convincing and more time progressing real opportunities.
Automation also plays a quiet but meaningful role here. Every repetitive task your reps no longer have to do frees them up to have more thoughtful conversations with the people who are actually ready to buy. In fact, many teams see their CPA drop simply because automation eliminates the lag between steps.
Repurposing content is another practical way to keep costs steady without sacrificing reach. You’ve probably created whitepapers, videos, or nurture emails that performed well once, and using them again in new formats often saves hours of work while still delivering impact. This matters because the more consistently you show up with helpful content, the easier it becomes to bring in prospects who already understand your value before they ever speak to a rep.
7. Sales Velocity
Once you understand acquisition cost, the next natural question is how quickly revenue flows through your pipeline, which is where sales velocity comes into play.
Sales velocity shows how quickly revenue moves through your pipeline, and it is one of the best indicators of how healthy and predictable your sales engine really is. Since it blends four inputs: number of opportunities, average deal value, win rate, and sales cycle length, it gives you a more honest picture of performance than looking at those metrics individually.
The formula often used to calculate sales velocity is (Number of Opportunities × Average Deal Value × Win Rate) / Sales Cycle Length, which helps teams see how quickly revenue is moving through the pipeline. In practice, this means you can usually tell whether your quarter will be strong long before deals actually close, simply by watching how velocity trends week over week.
Why sales velocity is valuable:
- It shows how efficiently opportunities convert to revenue.
- Small improvements create compounding gains.
- It highlights whether pipeline volume aligns with revenue goals.
Teams often underestimate how sensitive velocity is to small shifts. For example, shortening your sales cycle by even a few days can noticeably lift velocity because deals flow through the pipeline more smoothly. Increasing average deal value has a similar effect, especially when paired with consistent qualification. And because velocity incorporates win rate, it helps you see whether your team is progressing the right opportunities instead of spending time on deals unlikely to close.
A helpful way to evaluate velocity is to break it down by segment, marketing channel, or deal type. This matters because different groups move at different speeds, and a single aggregated score can hide patterns that would otherwise guide smarter decisions. For instance, you might discover that outbound deals move slowly but close at higher values, while inbound deals move quickly but close at lower values. Understanding these differences helps you balance your pipeline intentionally rather than relying on guesswork.
To diagnose changes in velocity:
- If velocity drops, review stage delays and follow up on consistency.
- If velocity rises, identify which improvements had the biggest impact.
In fact, many teams notice that velocity tends to slow down long before win rate declines. This usually shows up as stalled mid-stage deals or inconsistent follow-ups. When you spot it early, you can adjust your messaging, revisit qualification, or review pipeline distribution to prevent a broader slowdown.
Common improvement opportunities:
- Shortening sales cycles with clearer content.
- Increasing deal value by packaging offerings more effectively.
- Strengthening qualifications to improve win rates.
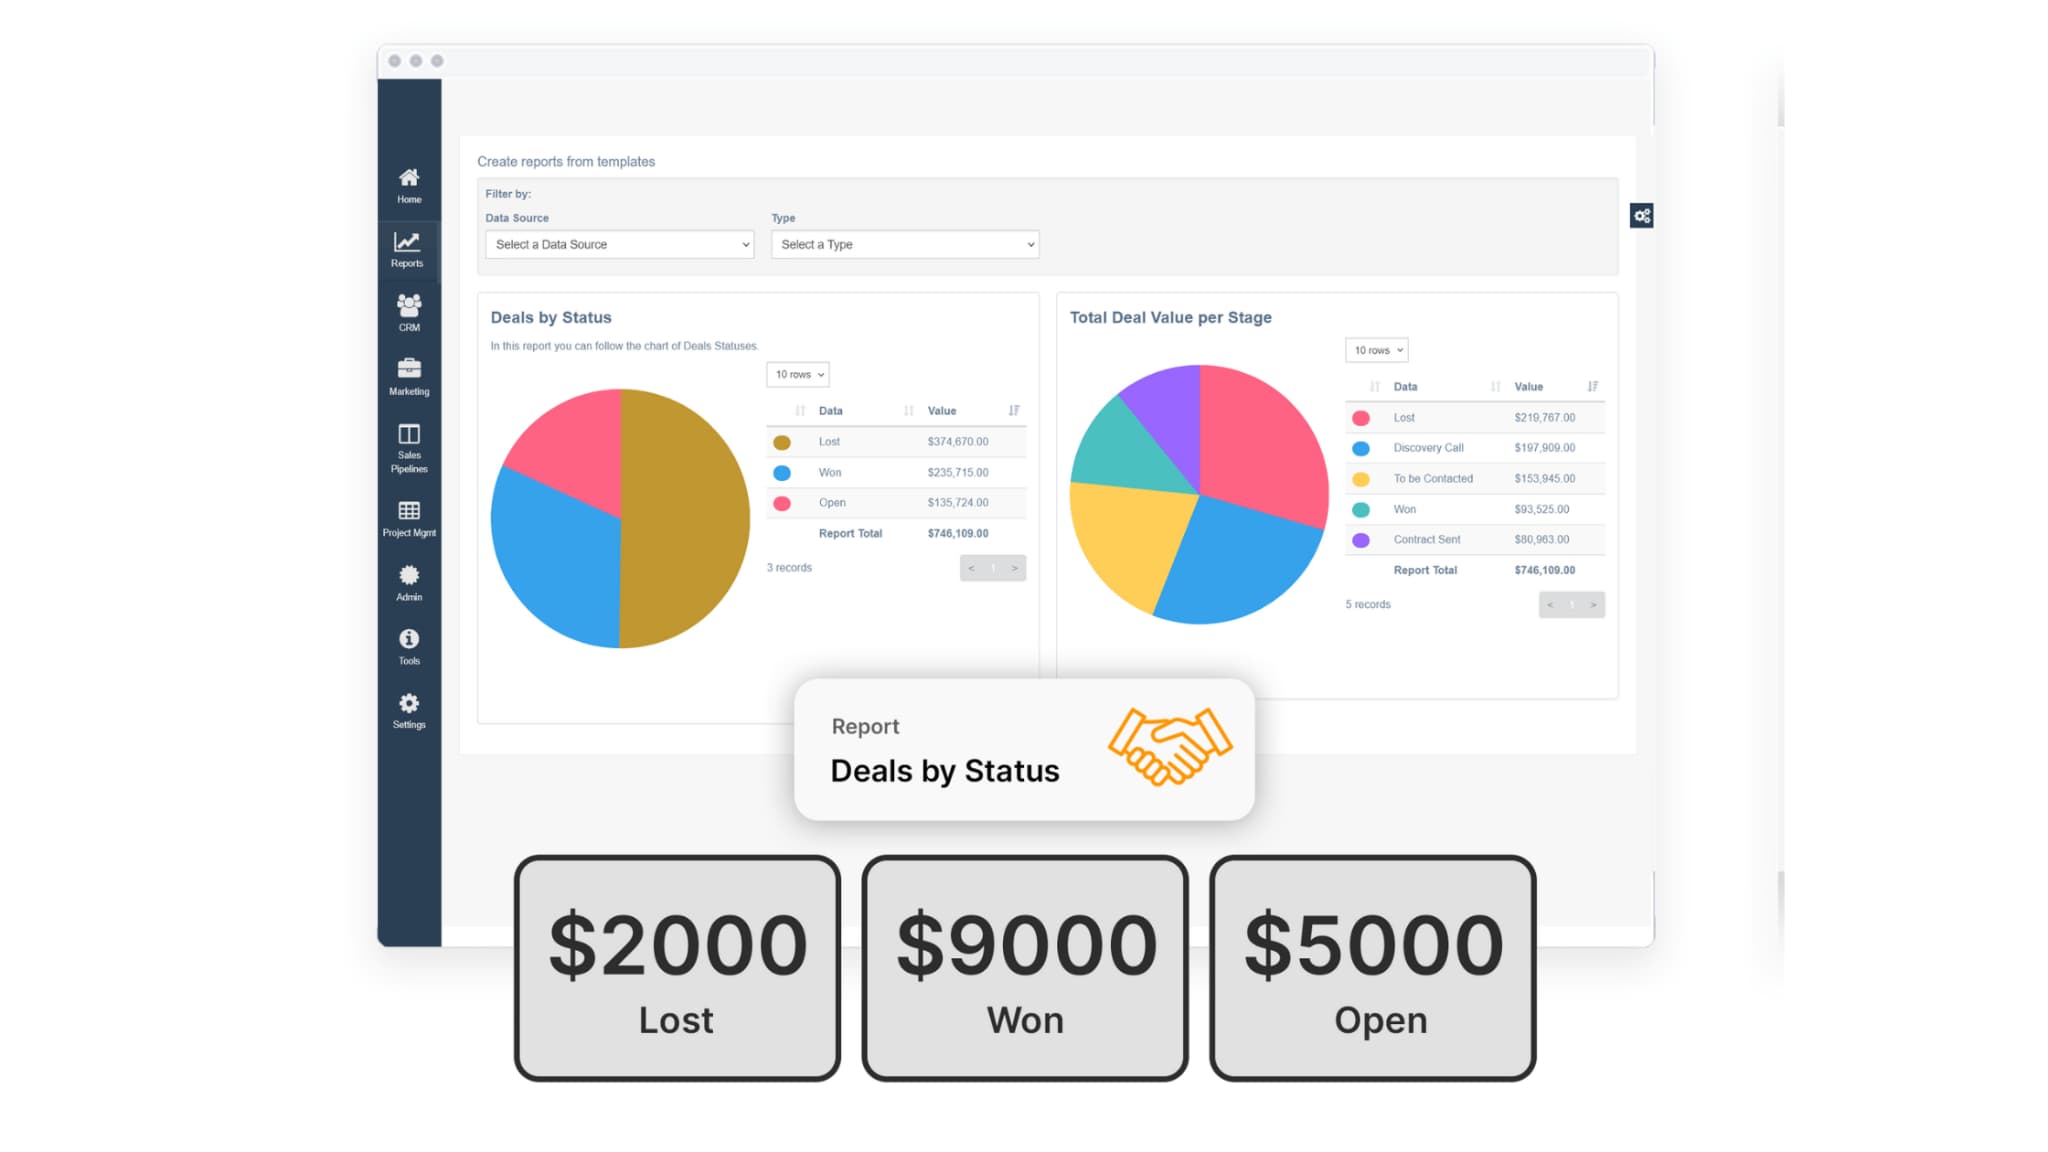
If you want a place to analyze velocity more deeply, Pulse's reporting features can help you break down deal flow and identify which changes create the strongest lift. Understanding these connections helps teams focus their efforts where they will make the biggest difference, rather than trying to optimize everything at once.
8. Sales Cycle Length
Since velocity depends in part on how long deals take to close, examining sales cycle length helps you see what speeds buyers up or slows them down.
The sales cycle length shows how long it typically takes a prospect to move from the first conversation to the final decision, and it often reflects how well your process supports how buyers evaluate options today. Shorter cycles usually mean your messaging is clear, expectations are aligned, and prospects feel supported throughout their journey. Longer cycles, on the other hand, tend to reveal hesitation, confusion, or gaps in the information buyers need to move forward.
Why cycles lengthen
- Buyers may need more education or reassurance before committing.
- Multiple stakeholders often have to agree, each with different priorities.
- Messaging or value explanations may feel unclear or incomplete.
In many teams, slowdowns appear in the middle of the process, not the beginning. This happens when prospects understand the high-level idea but lack the details they need for internal discussions or budget approval. You’ve likely seen situations where a buyer seems enthusiastic after a demo but goes quiet for weeks, not because they lost interest, but because they couldn’t confidently explain the solution to someone else on their team. When this happens consistently, it is usually a signal that your content or follow-ups need to better support internal conversations.
What teams can review
- Stage-by-stage delays to identify where deals commonly stall
- Enablement gaps, such as missing comparison guides or ROI examples
- The timing and quality of follow-ups, especially after high-intent actions
Looking at cycle length by segment or deal type can reveal patterns you might miss in aggregate data. Enterprise deals, for example, naturally move more slowly due to longer internal evaluation processes, while smaller accounts typically move faster. When teams break this data down, they can set more realistic expectations and avoid misjudging healthy deals as stalled.
Ways to shorten sales cycles
- Simplify early messaging so buyers grasp the value quickly
- Provide clear next steps immediately after demos or key calls
- Anticipate objections earlier in the process so buyers feel prepared
This matters because cycle length directly affects pipeline predictability. Even a small reduction, such as cutting three to five days from the middle stages, can increase velocity and improve end-of-quarter pacing. You can also use reporting tools to see how cycle patterns change over time and identify which adjustments yield the greatest improvements.
Sales cycle analysis helps teams uncover the specific moments where buyers hesitate and gives them the insight needed to remove friction with more relevant content, clearer communication, and better-timed follow-up.
9. Win Rate
And once you understand how long deals take, the final piece is determining how many of them actually close, which makes win rate one of the most telling metrics.
Win rate shows the percentage of opportunities that turn into actual closed won deals, and it often reflects the real strength of your sales process more clearly than any other metric. A rising win rate usually means your team is speaking to the right people, communicating value effectively, and guiding buyers through the decision process with less friction. When win rate dips, it is often one of the earliest signals that something in your process is out of sync with what buyers need.
The formula most teams use to calculate win rate is (Number of Wins / Total Opportunities) × 100%, which gives you a clear, simple view of how often your pipeline converts into real revenue.
A strong win rate usually indicates:
- Effective targeting
- Clear value articulation
- Strong buyer alignment
One of the most helpful ways to use win rate is to break it down by segment, marketing channel, or deal type. This matters because not all opportunities behave the same. For example, inbound demos may close faster but at lower deal values, while outbound deals take longer but close at higher rates. When you analyze win rate through these smaller lenses, you start to see which areas reliably drive revenue and which require deeper refinement.
A weak win rate may suggest:
- Competitive pressure
- Poor qualification standards
- Misaligned messaging or pricing clarity
In many cases, win rates decline because buyers do not fully understand the differences between your solution and a competitor’s, or they feel uncertain about the value relative to the cost. You have probably seen situations where deals seem solid throughout the entire process but fall apart late in the cycle because a stakeholder raised a concern that had never been surfaced earlier. When this pattern repeats, it usually means earlier conversations need sharper messaging or better discovery.
Another useful approach is to look at the win rate alongside the time spent in each stage. If a deal lingers too long in one stage before ultimately being lost, it may suggest that buyers hit an information gap or objection that was never fully addressed. Research from the Harvard Business Review highlights how internal misalignment inside buying teams often slows down decisions, which means sellers must do more to support those conversations, not just the one happening on the call.
Ways to interpret win rate trends:
- Compare the win rate by segment to identify the strongest markets
- Analyze the win rate by lead source to understand channel effectiveness
- Review lost deal reasons to guide coaching and content development
For teams who want more precision, pairing win rate with qualitative insights from loss analysis can create a more complete picture. Even a simple monthly review of lost-deal notes can reveal recurring themes, such as missing features, an unclear pricing structure, or timing issues on the buyer side. This type of pattern recognition helps leaders prioritize which improvements will have the most impact.
When monitored consistently, the win rate becomes a steady guide for improving your entire revenue process. It shows whether you are attracting the right buyers, whether your conversations are meaningful, and whether your team is equipping prospects with the information they need to make a confident decision. Win rate becomes even more valuable when paired with stage conversion data because it highlights where prospects disengage.
Diagnostic Table: How to Interpret Each Metric
